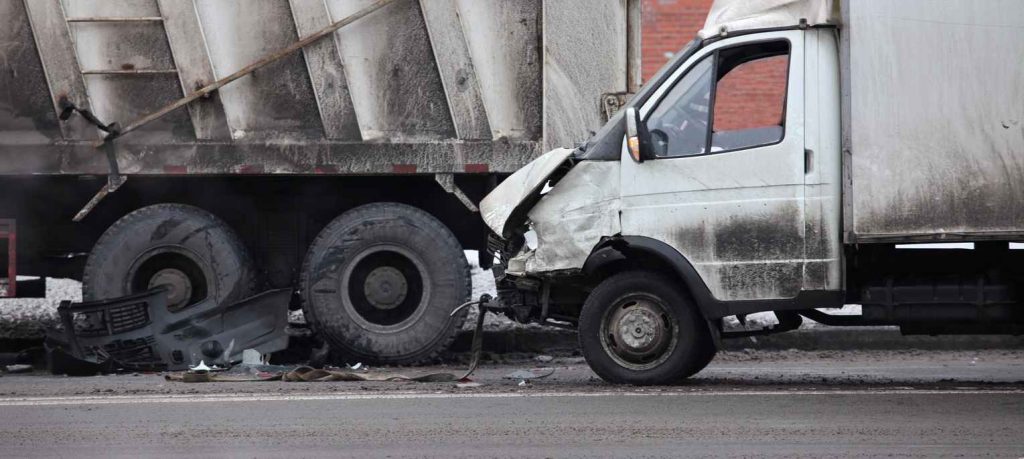
The latest Large Truck and Bus Crash Facts report was released earlier this year and contains data from 2017.

The Large Truck and Bus Crash Facts is an annual report released by the Federal Motor Carrier Safety Administration (FMCSA) that describes the situation of car accidents involving large vehicles from a certain period of time, on US territory. FMCSA compiles data taken from various statistics and provides a comprehensive analysis of that data, in a wider context.
The latest Large Truck and Bus Crash Facts report was released earlier this year and contains data from 2017, which is put into context by comparing results from previous years with the latest statistics.
Large Truck and Bus Crash Facts for 2017
The LTBCF report is organized into four sections:
- Trends – presenting current data in historical context to illustrate trends and possible causes
- Crashes – counts of crashes, three-years statistics where relevant
- Vehicles – counts of vehicles involved in crashes
- People – counts of people involved in crashes, whether they were drivers, occupants or pedestrians.
In these sections, counts are presented by themselves and by comparisons with other data, taking into account the following:
- Crashes: counts of crashes
- Vehicles in crashes: types of vehicles involved in the crash
- People in crashes: all the people who were involved in the crashes, demographics, victims, where they were at the time of the cars
- Drivers in crashes: counts of vehicle drivers involved in crashes
Here we will detail some of the most interesting findings in the Large Truck and Bus Crash Facts report 2017. We will present them as they are organized in the report, by chapter.
Trends
From 2016 to 2017, there was a 9% increase in the number of accidents involving large trucks and buses, with the number of fatal crashes increasing by 8%.
In the case of bus crashes, a historical low was registered in 2017, since the first LTBCF report in 1975. Only 73 school buses and 13 intercity buses were involved in fatal crashes in 2017.
At the same time, the number of large trucks involved in fatal crashes increased, as did their involvement rate. Over the past year (at the time of the data collection,) the number of large vehicles in car crashes raised from 4,251 to 4,657.
Crashes
23% of the police-reported crashes that involved large trucks were injury crashes, with 1% being fatal. The total number of police-reported crashes in 2017 was about 450,000.
Of all large vehicle fatal crashes, 63% involved two vehicles and 20% a single-vehicle.
Large trucks were often involved in crashes when crossing rural areas (57% of fatal crashes), Interstate Highways (27% of fatal crashes), or both (13% of fatal crashes).
Vehicles
Critical precrash event: in 73% of the cases, it was another vehicle, a person, an animal or an object on the large truck’s lane; in 23% of the cases, it was the large vehicle’s own movement.
People
Safety issues: 9% of the large truck drivers involved in fatal accidents were not wearing a seatbelt. 45% of them were killed in the crash.
Driving under influence: 5% of large vehicle drivers in fatal crashes consumed drugs (with 59% of the total not even tested). When compared to the number of drivers of all vehicles involved in crashes, you can see a decrease (15% of the total tested positive for at least one drug).
This data is only a fraction of all the information provided by the LTBCF report of 2017. These numbers not only give us an insight into how trends change over the decades, but it also gives us practical information when it comes to road safety and dangers.
If you have been involved in a St. Louis car accident, get in touch with an experienced attorney to ensure your legal right to compensation is protected right from the start of your claim. Give us a call 24/7 at (314) 361-4242 for a FREE case evaluation.
